Silhouette (clustering)
Silhouette refers to a method of interpretation and validation of clusters of data. The technique provides a succinct graphical representation of how well each object lies within its cluster. It was first described by Peter J. Rousseeuw in 1986[1].
Method
Assume the data have been clustered via any technique, such as k-means, into  clusters. For each datum
  , let
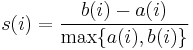
, let  be the average dissimilarity of with all other data within the same cluster. Any measure of dissimilarity can be used but distance measures are the most common. We can interpret as how well matched is to the cluster it is assigned (the smaller the value, the better the matching). Then find the average dissimilarity of with the data of another single cluster. Repeat this for every cluster of which is not a member. Denote the lowest average dissimilarity to of any such cluster by
  . The cluster with this average dissimilarity is said to be the "neighbouring cluster" of as it is, aside from the cluster is assigned, the cluster in which fits best. We now define:
Which can be written as:
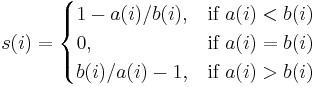
From the above definition it is clear that
For  to be close to 1 we require
  . As is a measure of how dissimilar is to its own cluster, a small value means it is well matched. Furthermore, a large implies that is badly matched to its neighbouring cluster. Thus an close to one means that the datum is appropriately clustered. If is close to negative one, then by the same logic we see that would be more appropriate if it was clustered in its neighbouring cluster. An near zero means that the datum is on the border of two natural clusters.
The average of a cluster is a measure of how tightly grouped all the data in the cluster are. Thus the average of the entire dataset is a measure of how appropriately the data has been clustered. If there are too many or too few clusters, as may occur when a poor choice of is used in the k-means algorithm, some of the clusters will typically display much narrower silhouettes than the rest. Thus silhouette plots and averages may be used to determine the natural number of clusters within a dataset.
References
- ^ Peter J. Rousseeuw (1987). "Silhouettes: a Graphical Aid to the Interpretation and Validation of Cluster Analysis". Computational and Applied Mathematics 20: 53–65. doi:10.1016/0377-0427(87)90125-7.